We are proud to announce that Scailable has been acquired by Network Optix.
For the announcement on the Network Optix website, move here.
Apples and Oranges: Profiling Edge AI solutions
In this post we examine in some detail a question that we get repeatedly: “How does deployment of Edge AI models using the Scailable AI manager, on Scailable selected hardware, compare to other deployment methods in terms of performance?”. Although the question seems easy, the answer needs a bit more explanation which we try to provide in this post.
Comparing deployment methods according to…
The first difficulty when trying to answer the comparison-question asked is the obvious: how do we measure “performance”? Two options come to mind:
- We might measure performance of an edge AI / ML model in terms of its accuracy. Thus, we might be interested in the performance of some AI/ML model, given a test set providing the “correct” answers. We can be very short about this one: if you upload an AI pipeline from (e.g.,) TensorFlow, Teachable Machine, PyTorch, or Edge Impulse by (for example) using ONNX, the Scailable AI manager deployment is one-to-one. You will get the exact accuracy as you got when training the model. Thus, you can safely profile the performance of your model using your desired training tools, and rest assured that when you are using Scailable to deploy your model to the edge, the performance–in terms of model accuracy–remains the same.
- We might measure the performance of an edge AI / ML model in terms of its computational speed. Thus, how long does it take to generate an inference? This is the question we will address in this post, but please be aware that there are many moving parts; we will try to highlight a number of these moving parts and subsequently we will try to answer the “performance in terms of computational speed” question of the Scailable AI manager as precisely as we can.
A second difficulty is the comparison “target”: while edge AI deployment using the Scailable AI manager is clearly defined, we are often asked to reference compared to “docker deployment”, or compared to “ONNX runtime deployment”; neither of these provides one single instance of a full AI/ML pipeline running on an edge device. Rather, both of these options (and multiple options like it, such as the NVIDIA tooling for deployment on NVIDIA devices), contain a very large number of moving pieces when you start thinking about the full pipeline: how do we grab sensor input data to feed to the model? How do we pre-process the sensor data before feeding it to the model? How do we optimize the model itself for edge deployment? How do we deal with the model output and its subsequent upstream delivery? When all of these questions are undefined, it is hard to provide valid comparisons. However, we will give it a try anyway.
Measuring computational speed of an edge AI solution
The first thing to notice when thinking about the quantifying computational speed of an edge AI solution is to consider the full “pipeline” running on the edge device as opposed to merely considering the inference speed. The following image provides an overview:

For virtually any edge AI or ML application, the full pipeline starts by grabbing the input data from some sensor (for example from a camera). Next, the raw sensor data (i.e., the video stream) needs to be decoded into the appropriate input tensor for the edge AI model. Often we need to pre-process the input data (recolor, resize, normalize, etc.). Next, the input tensor is “fed to” the AI/ML model. Actually, this point is where most people start profiling, but the earlier steps just described often take a significant amount of time in the full inference process. After the AI/ML model has produced its output (for example a set of coordinates of bounding boxes), the output often needs to be post processed (i.e., count the number of bounding boxes that bound a car in the image) and it needs to be submitted to an application platform (for example an ERP system).
If one wants to truly understand the computational speed of the solution, one needs to understand all the bits and pieces involved. Here are a few common observations from our end:
- For vision applications the camera used can have a tremendously large impact on the whole pipeline. How much do the images need to be resized? Can we grab individual images quickly, or do we need to decode a video stream? A camera that provides sufficient quality pictures of the input size of the model, and on which it is possible to rapidly access individual frames, is often most feasible.
- At the pre-processing stage we often see a lot of “spaghetti code”. While most data scientist spend ample time optimizing their model, hardly any engineering is devoted to optimizing “feeding the input data into the model”. We see people using containers (or other virtualization options), to read out images using common python packages, use numpy or the like to resize and normalize, etc. These are layers upon layers of abstraction, whereas with the Scailable AI manager, for each selected device, we have an extremely low level integration with the sensor I/O and use pretty much bare-metal pre-processing. Actually, just this step often ensures that Scailable AI manager deployment is an order of magnitude faster than any of the other options we compare to. We simply care about a low level, highly performant, implementation of the full pipeline as opposed to merely optimizing the model.
- At the model stage we often see a lot of effort, and for some models rightfully so: one can often obtain comparable performance (in terms of accuracy) with smaller models by pruning, quantizing, or otherwise changing the architecture of a model. And, hardware acceleration can go a long way: ensuring that costly model operations, such as convolutions, are efficiently ran on the available hardware (GPU, TPU, NPU, etc.) is highly important. Interestingly, the Scailable AI manager does this for you. So, although at this stage we are mostly simply on-par with any optimized solution, the Scailable AI manager ensures performance without any additional embedded or data engineering.
- We even find that post-processing can be a challenge. Many data engineers are way too focussed on optimizing their model and they forget the next steps; where does my data go and what should it look like. Simple low level JSON parsing can be orders of magnitudes faster than high-level implementations.
Now, to be honest, pretty much any time we get a question about “performance”, one or multiple of the above are poorly defined. Sure, it is easy to profile two specific implementations, but “deployment using the ONNX runtime” is not an end-to-end implementation and leaves many nobs to turn.
So, where do we stand?
We hope the above somewhat illustrated the complexities involved in answering the (computational speed) performance question. But where does this leave Scailable in comparison to others? (“Yes, so now I understand the question is hard, but please do give me an answer…”). Well, this is where we are:
- If you fully optimize your input sensor reading and preprocessing for a specific device using a super low-level, highly performant implementation (without loads of Docker / VM layers etc.), you might reach the performance of the Scailable AI manager in these first steps. More often however we find that the implementations data scientists default too are at least 10 times as slow as the Scailable AI manager implementation in the pre-processing stage. So, there is a big win at these first stages.
- For model execution, the Scailable AI manager is on-par with specifically compiling the model for the target hardware. Thus, if you, for example, use darknet for object detection and compile it toward your target hardware you will be as fast as the Scailable implementation. Interestingly, most people don’t even do this and add many layers of “user friendly coding tools”; each of which hinders execution speed. The Scailable AI manager is extremely user friendly, but doesn’t add all these layers of abstraction. We make things user friendly by making the options configurable (whilst still having a low level integration) as opposed to providing a large number of high level functions that simply hinder performance.
- For post-processing we are as fast as you can be with pretty much any low level C implementation.
So, we often find that we are orders of magnitude faster throughout the whole pipeline. Interestingly, this is often not primarily driven by any “magical optimization of the model”; in a way we simply use an optimized version of the model for the target hardware which an experienced data scientist can (or well, “should be”) able to build themselves. Rather, a lot of our gain is often in the surrounding pipeline; this type of low-level engineering is usually uncommon to those building AI/ML models. This is where a lot of the value of using the Scailable platform comes from.
So, we often find that we are orders of magnitude faster throughout the whole pipeline.

Why We Are Joining Network Optix
Today, the entire Scailable team is joining Network Optix, Inc., a leading enterprise video platform solutions provider headquartered in Walnut Creek CA, with global offices in Burbank CA, Portland OR (both USA), Taipei Taiwan (APAC HQ), Belgrade Serbia, and shortly in Amsterdam (EU HQ). Network Optix, since its founding, has set out to “solve” video […]

Scailable supporting Seeed NVIDIA devices
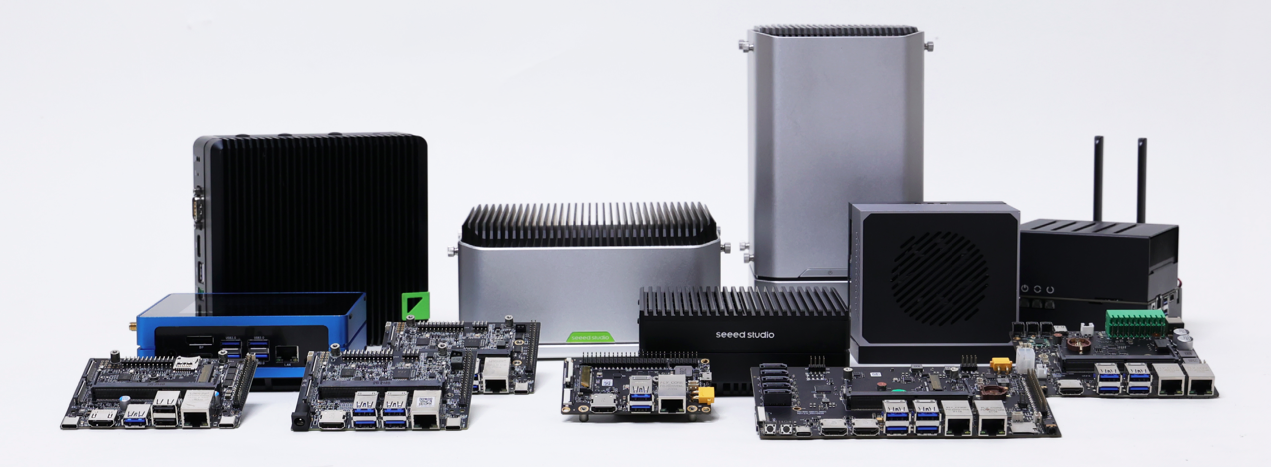
We are excited to announce support for Seeed’s NVIDIA Jetson devices. The AI manager, and all our edge AI development tools, can now readily be used on Seeed devices. As we all know, edge AI solutions often start from creative ideas to optimize business processes with AI. These ideas evolve into Proof-of-Concept (PoC) phases, where […]

From your CPU based local PoC to large scale accelerated deployment on NVIDIA Jetson Orin.
Edge AI solutions often start with a spark of imagination: how can we use AI to improve our business processes? Next, the envisioned solution moves into the Proof-of-Concept (PoC) stage: a first rudimentary AI pipeline is created, which includes capturing sensor data, generating inferences, post-processing, and visualization of the results. Getting a PoC running is […]